Auto-deploying a Container Monitoring Platform
I was recently exploring container security monitoring solutions and came across {Falco}: an open-source sys-call based solution. Coupled with an interest in {AWS Cloudformation} templates (infrastructure-as-code), I thought it would be interesting to automate the entire deployment; a one-click solution.
All source material can be found on my Github repo: {container-monitoring-platform-automation}.
The file cloudformation_stack.yaml is pretty much all you need to get started. Head over to the AWS console and upload the YAML file. Fill in appropriate parameters, run and take note of the public IP assigned to the instance. Wait for about 10 minutes and then navigate to instance-public-ip:5601. You should see a Kibana instance with pre-configured indices and dashboards.
This project auto-deploys :
- AWS infrastructure
- Containerized instances of Elasticsearch and Kibana
- Sets up Falco with a Python integration to push alerts to ES
- An event-generator container and a custom Kibana dashboard.
More details are in the specifics sections below.
Cloudformation | Infrastructure
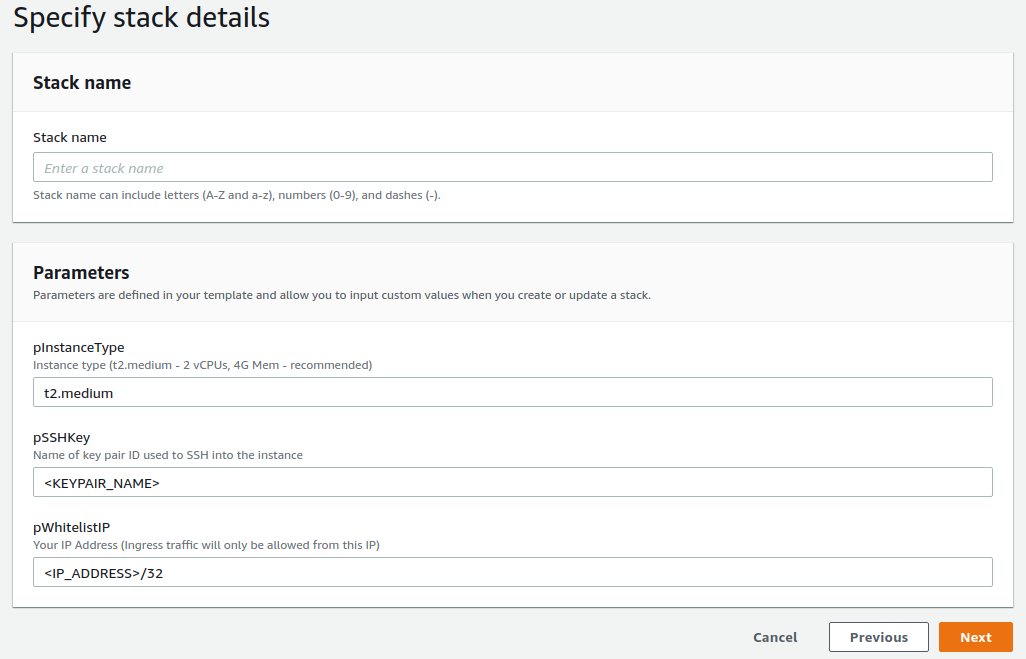
Inputs via console
- EC2 Instance-type:
t2-mediumrecommended. You will be charged for the instance, however, this instance for a few hours/days is inexpensive. The solution does not work ont2-microwith the little operating memory it has. - IP address to whitelist: The monitoring stack (Kibana) will respond to requests from this IP alone. Enter your public IP address suffixed with a
/32. - SSH key-pair name: You should already have one set up to SSH into your EC2-instances. If not, create a pair via console or CLI.
Outputs
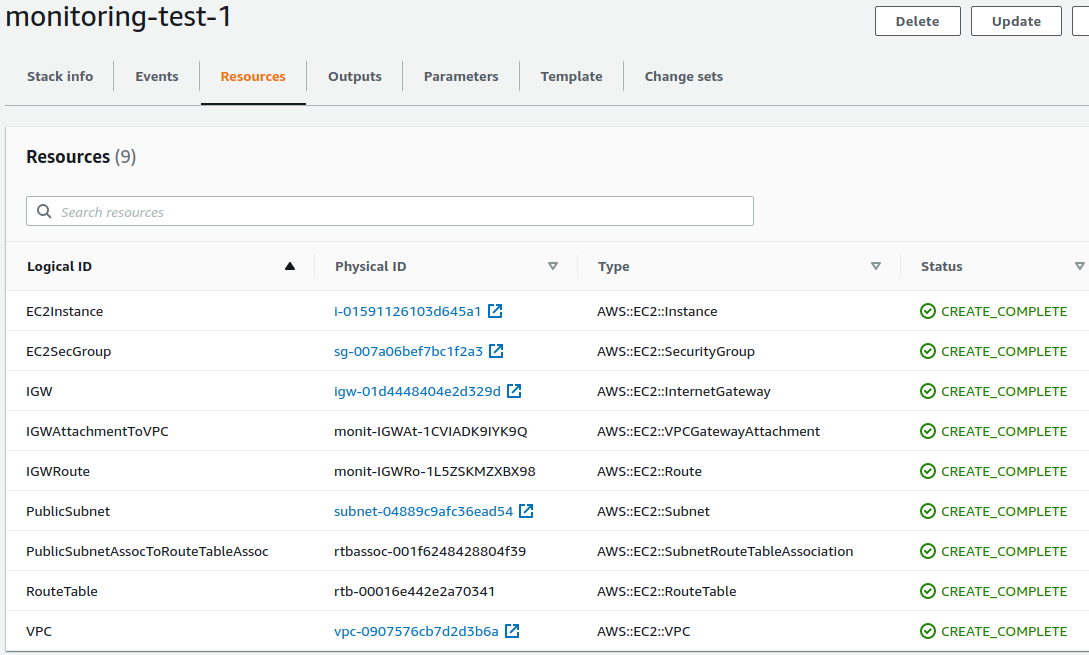
- A VPC with a (public) subnet, auto-public-IP assignment (non-elastic) and DHCP, Internet Gateway and appropriate route tables.
- An EC2 instance of the type specified earlier, launched into the public subnet.
- An EBS volume for the EC2-instance - gp2, 8GB.
- A security group that allows SSH (TCP/22) and Kibana via HTTP (TCP/5601) and the default all-outbound.
- EC2-instance user data. i.e. a shell script that will run on startup that pulls the file {ec2_setup.sh} from the repo and pipes it into bash.
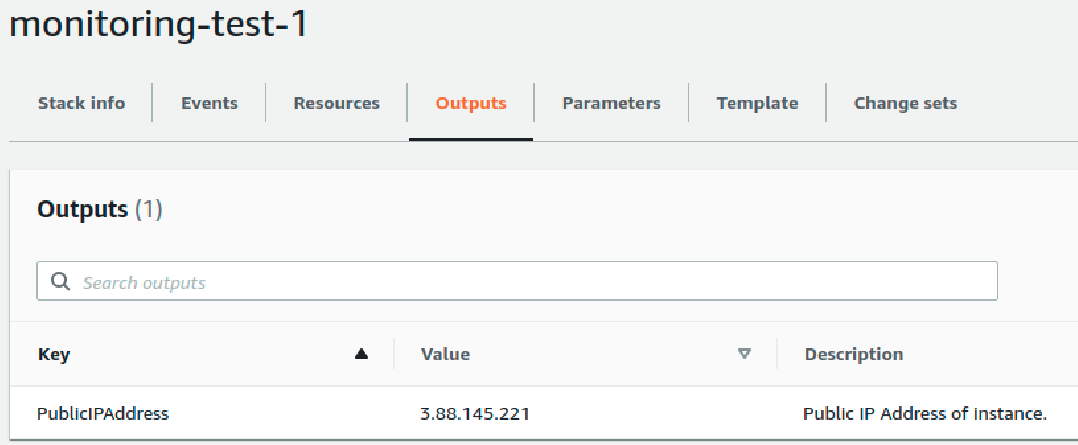
Run the Cloudformation script. Verify that all resources deployed successfully. The output section should display the public IP address of the machine.
AWSTemplateFormatVersion: 2010-09-09

Parameters:
  pInstanceType:
    Type: String
    Description: "Instance type (t2.medium - 2 vCPUs, 4G Mem - recommended)"
    Default: "t2.medium"
  pWhitelistIP:
    Type: String
    Description: "Your IP Address (Ingress traffic will only be allowed from this IP)"
    Default: "<IP_ADDRESS>/32"
  pSSHKey:
    Type: String
    Description: "Name of key pair ID used to SSH into the instance"
    Default: "<KEYPAIR_NAME>"

Resources:
  VPC:
    Type: AWS::EC2::VPC
    Properties:
      CidrBlock: "10.0.0.0/16"
      EnableDnsSupport: true
      EnableDnsHostnames: true
      InstanceTenancy: default
      Tags:
        - Key: "Name"
          Value: "container-monitoring-vpc"

  IGW:
    Type: AWS::EC2::InternetGateway
    Properties:
      Tags:
        - Key: "Name"
          Value: "container-monitoring-igw"

  IGWAttachmentToVPC:
    Type: AWS::EC2::VPCGatewayAttachment
    Properties:
      VpcId: !Ref VPC
      InternetGatewayId: !Ref IGW

  PublicSubnet:
    Type: AWS::EC2::Subnet
    Properties:
      AvailabilityZone: us-east-1a
      VpcId: !Ref VPC
      CidrBlock: "10.0.1.0/24"
      MapPublicIpOnLaunch: true
      Tags:
        - Key: Name
          Value: container-monitoring-public-subnet

  RouteTable:
    Type: AWS::EC2::RouteTable
    Properties:
      VpcId: !Ref VPC
      Tags:
        - Key: Name
          Value: container-monitoring-public-route-table

  IGWRoute:
    Type: AWS::EC2::Route
    DependsOn: IGW
    Properties:
      DestinationCidrBlock: "0.0.0.0/0"
      GatewayId: !Ref IGW
      RouteTableId: !Ref RouteTable

  PublicSubnetAssocToRouteTableAssoc:
    Type: AWS::EC2::SubnetRouteTableAssociation
    Properties:
      SubnetId: !Ref PublicSubnet
      RouteTableId: !Ref RouteTable

  EC2SecGroup:
    Type: AWS::EC2::SecurityGroup
    Properties:
      GroupName: "container-monitoring-sg"
      GroupDescription: "In: SSH (TCP/22), Kibana (TCP/5601). Out: ALL."
      VpcId: !Ref VPC
      SecurityGroupIngress:
        - IpProtocol: "tcp"
          FromPort: 22
          ToPort: 22
          CidrIp: !Ref "pWhitelistIP"
        - IpProtocol: "tcp"
          FromPort: 5601
          ToPort: 5601
          CidrIp:  !Ref "pWhitelistIP"
      SecurityGroupEgress:
        - IpProtocol: -1
          CidrIp: "0.0.0.0/0"

  EC2Instance:
    Type: 'AWS::EC2::Instance'
    Properties:
      SubnetId: !Ref PublicSubnet
      ImageId: "ami-0ab4d1e9cf9a1215a"
      InstanceType:
        Ref: pInstanceType
      KeyName: !Ref pSSHKey
      SecurityGroupIds:
        - Ref: EC2SecGroup
      BlockDeviceMappings:
        - DeviceName: /dev/xvda
          Ebs:
            VolumeType: "gp2"
            SnapshotId: "snap-03e9050b362f59715"
            VolumeSize: 8
            DeleteOnTermination: "true"
      UserData:
        Fn::Base64: |
          #!/bin/bash
          curl https://raw.githubusercontent.com/anishsujanani/container-monitoring-platform-automation/master/ec2_setup.sh | bash
      Tags:
        - Key: Name
          Value: container-monitoring-ec2

Outputs:
  PublicIPAddress:
    Description: "Public IP Address of instance."
    Value:
      Fn::GetAtt:
        - EC2Instance
        - PublicIp
User-data and configuration scripts
That script invoked by the user-data command pulls all other necessary files from the repo and sets up all moving parts.
- Installs Docker, kernel headers, Falco, Python dependencies.
- Runs containerized Elasticsearch and Kibana instances.
- Runs the Falco service with a custom configuration and a Python integration to ship alerts to the local Elasticsearch store.
- Sets up the Kibana index and creates a dashboard via the Kibana API. (Dashboard created and manually exported as a JSON - this file is in the repo.)
- Starts the Falco event generator container that triggers Falco rules and creates dummy events for a total of 5 minutes.
#!/bin/bash
yum -y update && yum -y upgrade
# install and run docker
amazon-linux-extras install docker -y
service docker start
# install kernel headers and Falco
rpm --import https://falco.org/repo/falcosecurity-3672BA8F.asc
curl -s -o /etc/yum.repos.d/falcosecurity.repo https://falco.org/repo/falcosecurity-rpm.repo;
yum -y install kernel-devel-$(uname -r);
yum -y install falco;
# pull scripts from Github
mkdir /custom_falco_config;
cd /custom_falco_config;
wget https://raw.githubusercontent.com/anishsujanani/container-monitoring-platform-automation/master/falco_custom.yaml;
wget https://raw.githubusercontent.com/anishsujanani/container-monitoring-platform-automation/master/aggregate_alerts.py;
# install ES lib for python3.x
pip3 install elasticsearch;
# run elasticsearch container
docker run \
-p 9200:9200 \
-p 9300:9300 \
--name elasticsearch \
-e "discovery.type=single-node" \
--rm \
-d \
docker.elastic.co/elasticsearch/elasticsearch:7.12.1;
echo "[!] Waiting for Elasticsearch to start, sleeping 20s"
sleep 20;
# run kibana container
docker run \
-p 5601:5601 \
--name kibana \
--link elasticsearch:elasticsearch \
--rm \
-d \
docker.elastic.co/kibana/kibana:7.12.1;
echo "[!] Waiting for Kibana to start, sleeping 30s"
sleep 30;
# run falco with paths to custom config files
falco -c ./falco_custom.yaml \
-r /etc/falco/falco_rules.yaml \
-r /etc/falco/falco_rules.local.yaml \
-r /etc/falco/k8s_audit_rules.yaml &
echo "[!] Waiting for Falco to start, sleeping 5s"
sleep 5;
# pull kibana dashboard as JSON
wget https://raw.githubusercontent.com/anishsujanani/container-monitoring-platform-automation/master/dashboard_export.json;
# create kibana index and dashboard via API
curl -X POST \
-H 'kbn-xsrf: true' \
-H 'Content-Type: application/json' \
-d @dashboard_export.json \
localhost:5601/api/kibana/dashboards/import;
# Run the event generator for 5 minutes
docker run --rm falcosecurity/event-generator run syscall --loop &
sleep 300;
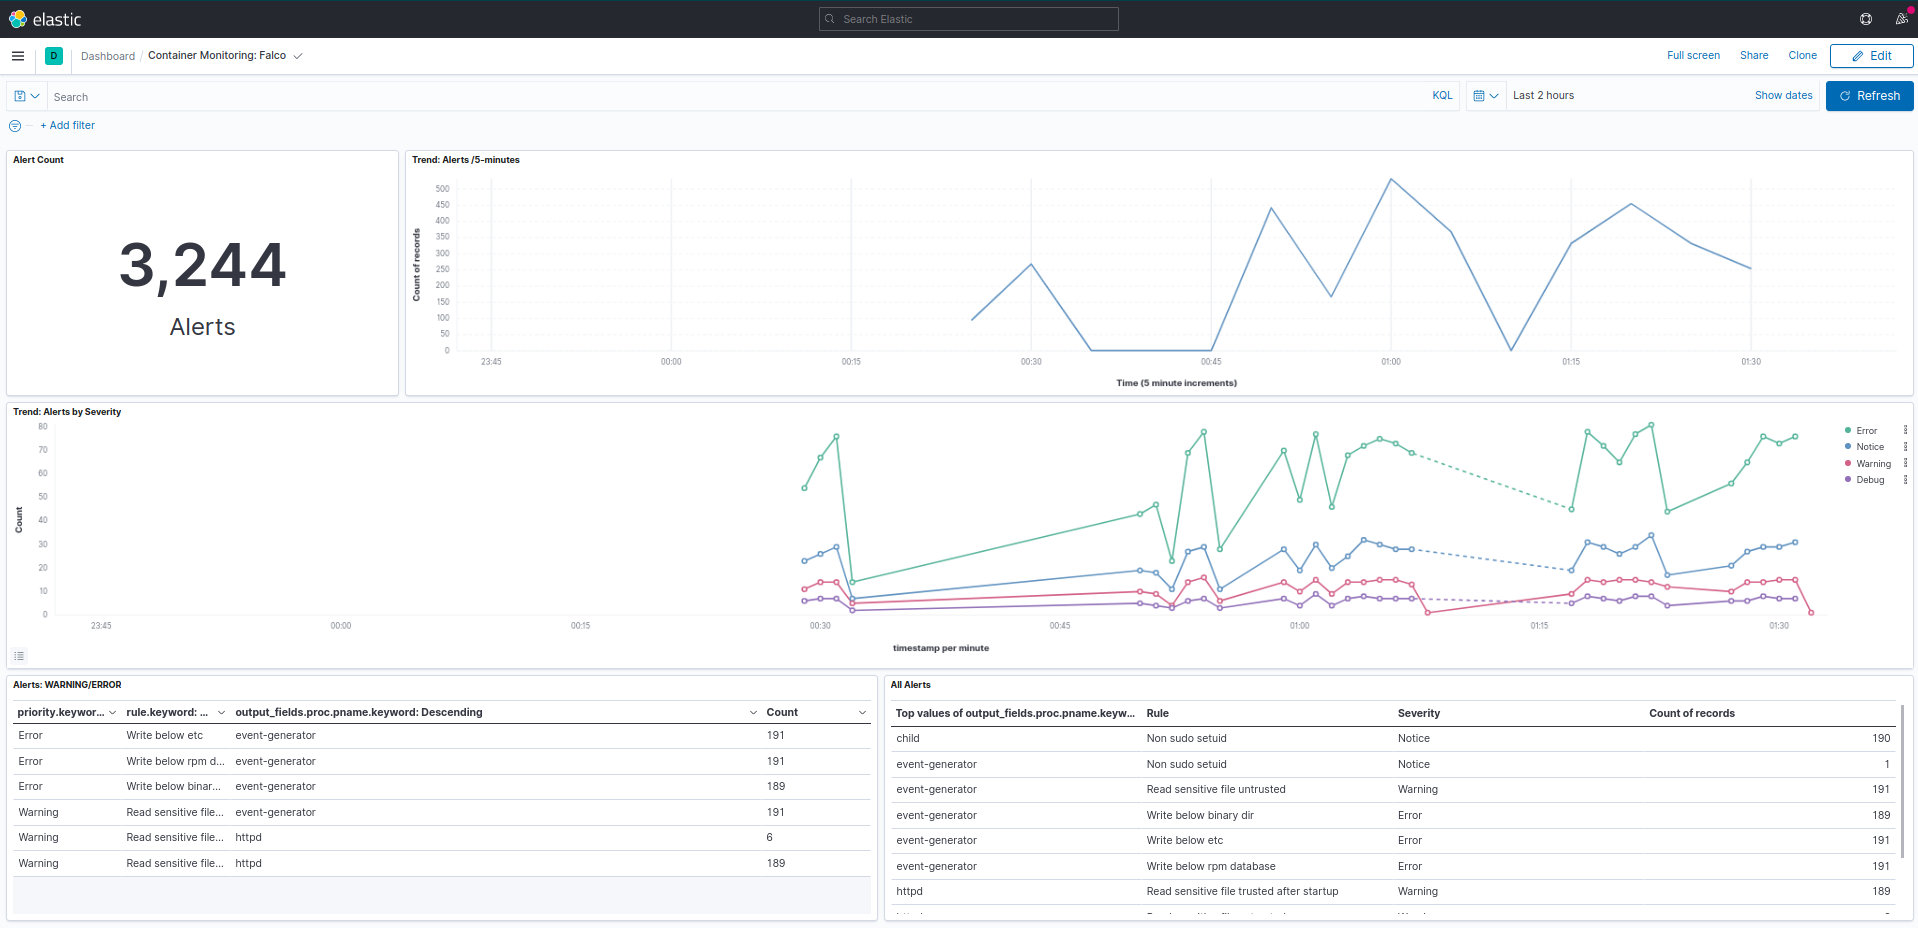
kill $!;The End Result
From a file upload to Kibana dashboards.
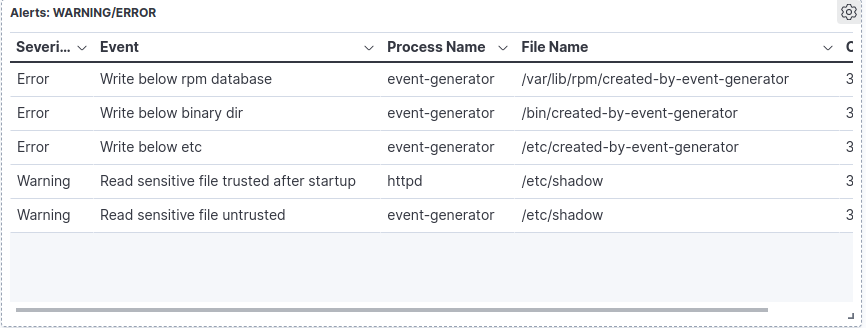
Notes:
- If you would like to continue running the testbed and/or play with the analytics yourself, simply SSH into the instance with the key pair you specified (user: ec2-user) as a parameter and run:
docker run --rm falcosecurity/event-generator run syscall --loop &to run the event-generator. - Falco runs by hooking into system calls made by the container runtime into the kernel. You may choose to run your own containers on the EC2 instance and trigger the rules if you do not prefer the event-generator container.
- If the solution isn’t deploying successfully or if you would like to monitor the status, you can view execution logs of EC2 user-data and subsequent scripts in
/var/log/cloud-init.logand/var/log/cloud-init-output.log. - To tear down the system after you’re done evaluating, delete the stack from the Cloudformation console and ensure that all the resources were deleted. Leave the default
rollback on failuresetting checked in the Cloudformation console. An S3 bucket will also be created to store the template, if it doesn’t exist already. You may empty and delete the bucket when done.
I am not affiliated with Falco in any way. This project was out of interest and all opinions are purely my own.